
Price list for committed-usage plans
Committed-usage plans are now billed per model at the prices on your price list. Once Impala has set up your committed-usage billing,GET /v1/account/prices returns that list, as it does on pay-as-you-go.Unknown job IDs fail the batch
A batch whosejob_id names no job now fails with the error code workload_resolution_rejected and the message Job not found: <job_id>. Before, it ran on a configuration Impala picked from the batch’s shape. See Jobs.Batches on fine-tuned LoRA adapters
You can now run a batch on your own LoRA fine-tune. Upload the adapter to your data plane’s resources bucket and setmodel to ft:<base-model>:<adapter-name>. A fine-tuned batch is billed as its base model, at the base model’s rate and size. BYOC data planes need a release that includes this change. See LoRA adapters in batch.Rate limit on the Usage page
The Throughput chart on the Usage page now draws your RPM limit as a dashed line. On a single model, the line shows the lower of your team limit and that model’s own limit. The chart also plots your busiest minute and marks time buckets with429 rejections as red dots. See See your limit on the Usage page.Running batches report their cost so far
A running batch now shows its cost so far instead of null. On the batch object,processing_cost is the sum of the batch’s parts priced yet while the new cost_status field is pending. It’s null only before any part is priced. cost_status turns final about 1–2.5 minutes after the batch’s last part ends, rather than waiting for every batch that shared its hardware to finish. price_1m_tokens likewise shows the price per million tokens so far, computed over the parts priced yet.On the dashboard, total cost now includes pending runs’ costs so far, so it can still change while any run’s cost is pending.Cost fields appear only for teams that are shown pricing.Scale to zero on by default for new BYOC data planes
New Bring Your Own Cloud data planes now scale to zero when idle. Workloads scale down to zero replicas and no scaler-managed GPU instances keep running. Submitting a batch wakes the region, so the first batch after an idle period waits for it to start. To opt out, contact your Impala account team. See Scale to zero.Billing API
Pull your usage, spend and prices as JSON with the same API key you use for inference. See Billing API.Spend by model
The billing card in Settings now includes a Spend by model table. It shows your spend per model for this month and last month, plus each model’s share of the total. Pay-as-you-go spend is visible to team admins only.Cumulative spend chart
The Settings billing card also plots your cumulative spend for this month against last month. When an estimate is available, the chart adds a projected month-end total so you can see where the month is heading.Usage counts each request once
The Usage page now counts each request you send once.Failed requests are split into two groups:- Request errors:
4xxresponses caused by the request itself. - Service errors: failures on Impala’s side, including timeouts.
Rate-limited requests on the Usage page
Requests rejected with HTTP429 by your API key’s or team’s rate limit now appear on the Usage page as request errors. Impala attributes these rejections to the model you requested, so each model’s figures include its own rate-limited requests. The failure breakdown also lists rate-limited requests as their own row. To follow limit changes automatically, see Rate limit webhooks.Run Tab
A dedicated tab listing every job ID in your workspace, with one-click copy on each row. Pair it with the batch API to launch runs straight from your code without hunting for IDs.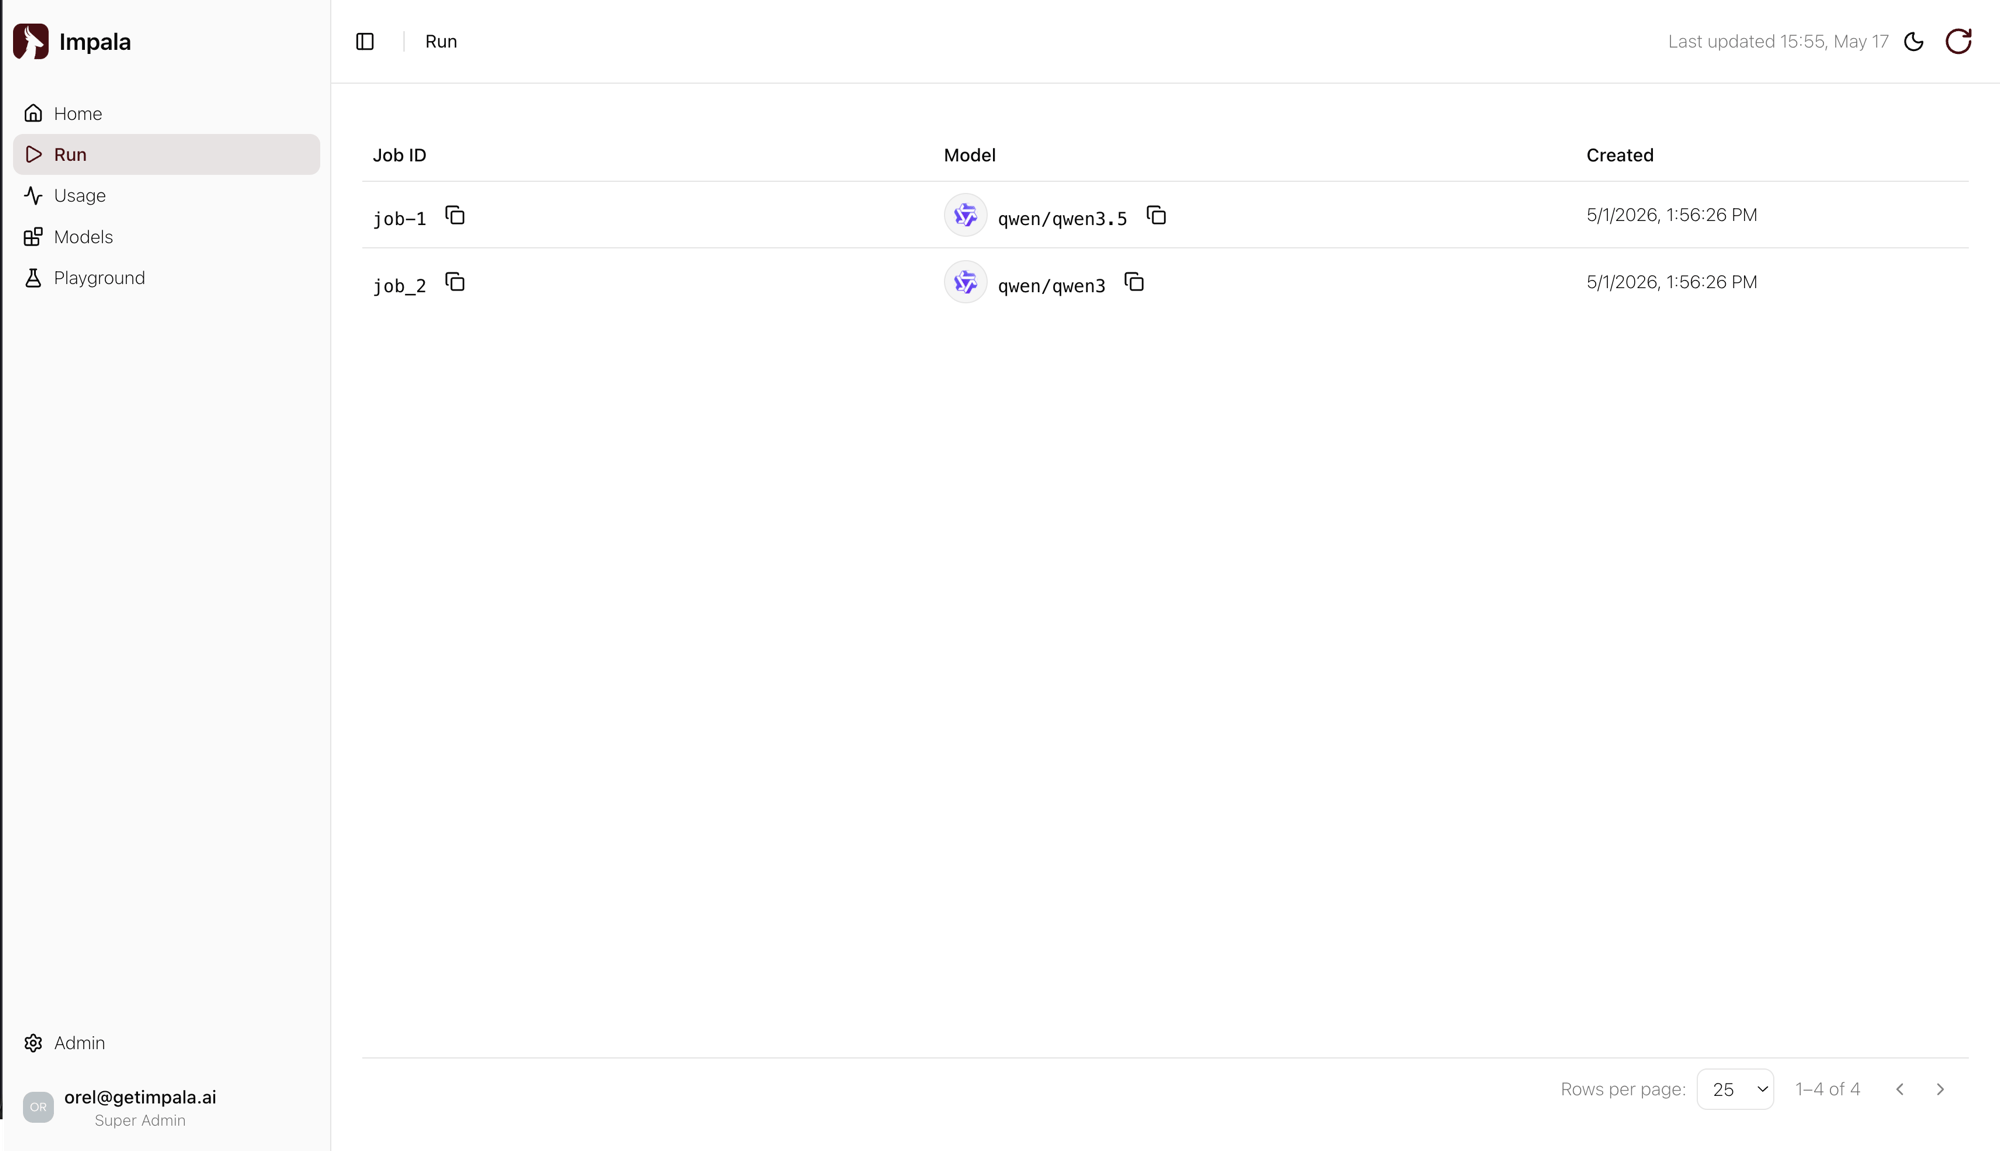
Home Tab
Real-time visibility into every run alongside aggregate metrics for total runs, cost, tokens, and run-status breakdown. Filter the view by 24h, 7d, 30d, 90d, or a custom range to focus on the window that matters.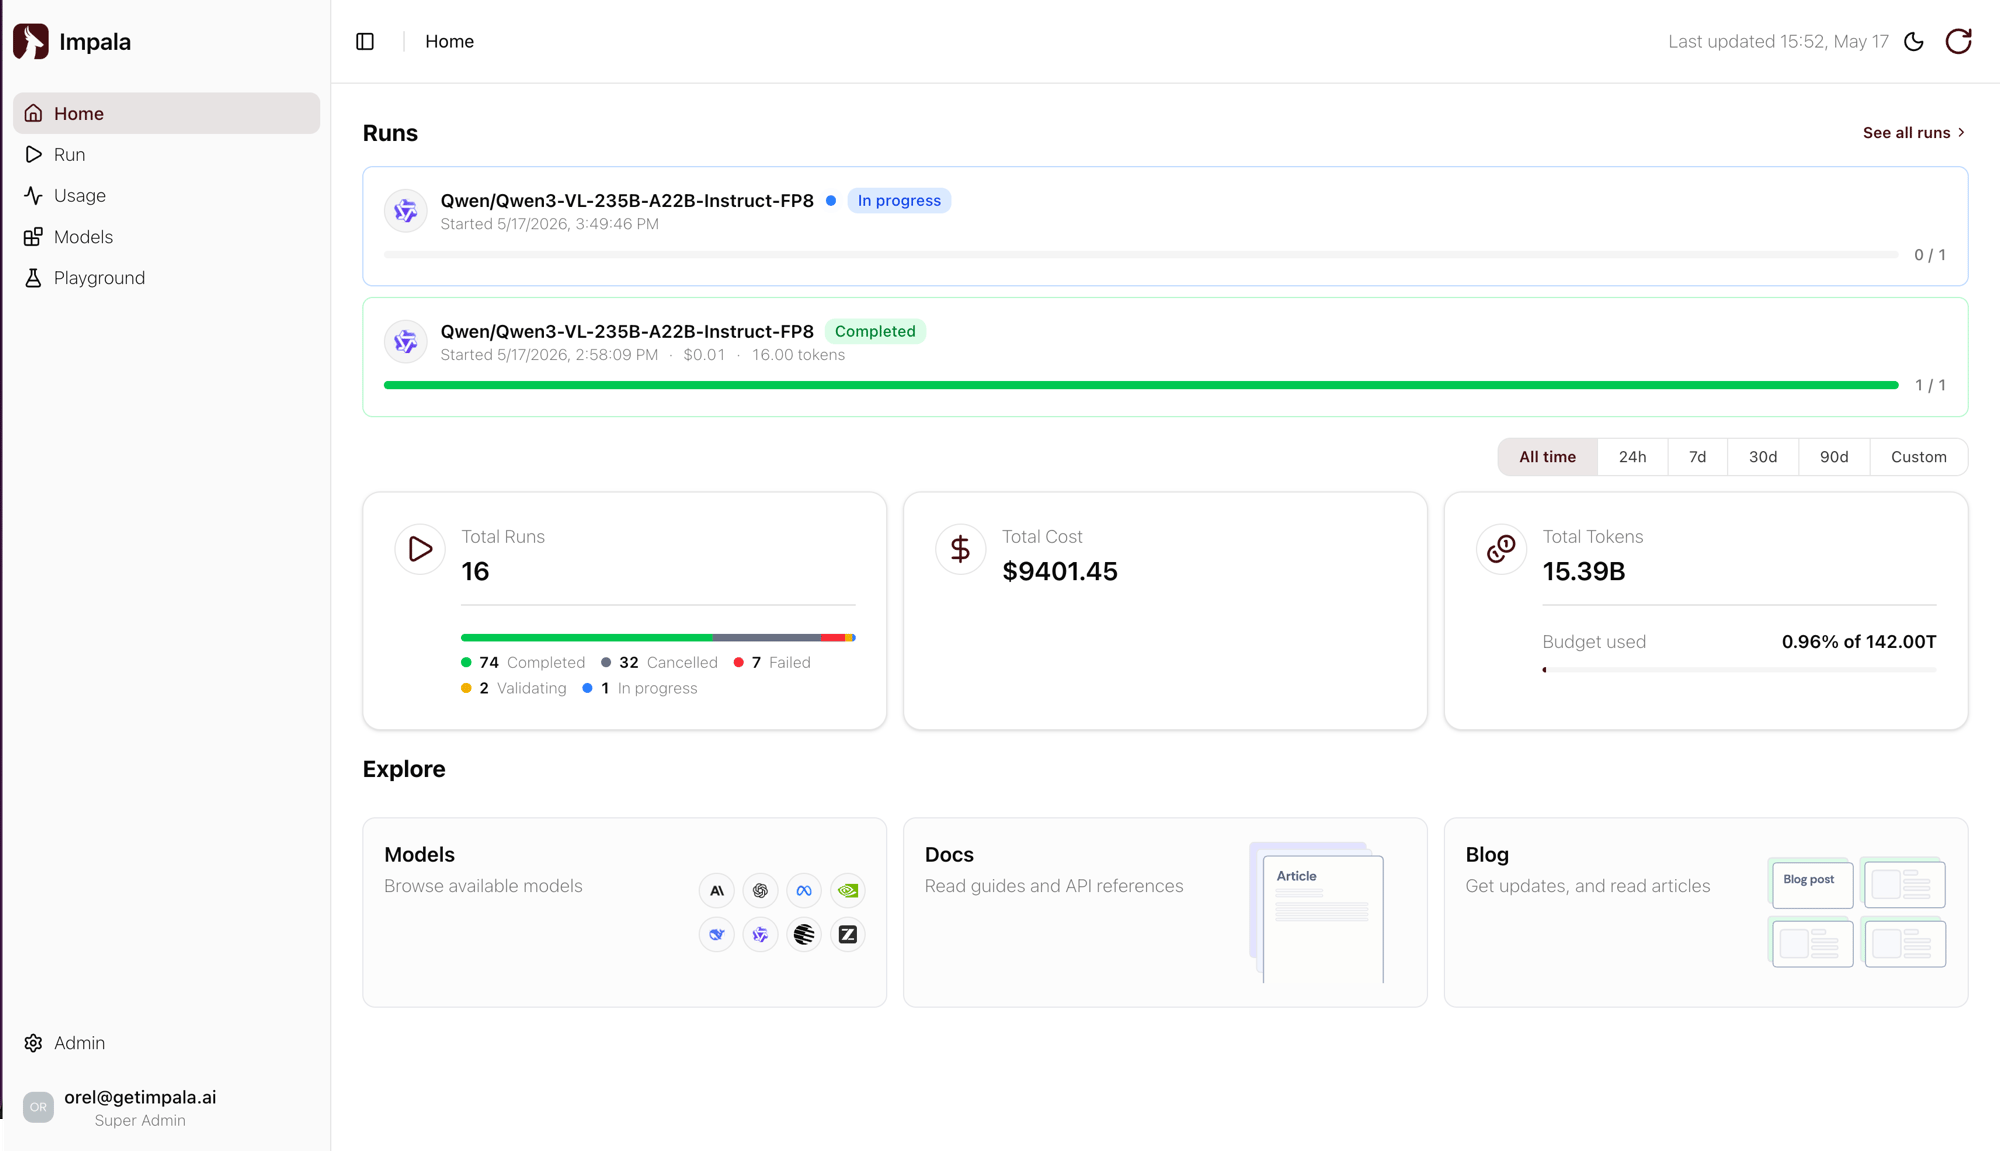
Playground Model Comparison
Compare responses from up to four models side-by-side in a single prompt. Broadcast one message to every selected model concurrently and pick the one that fits your use case.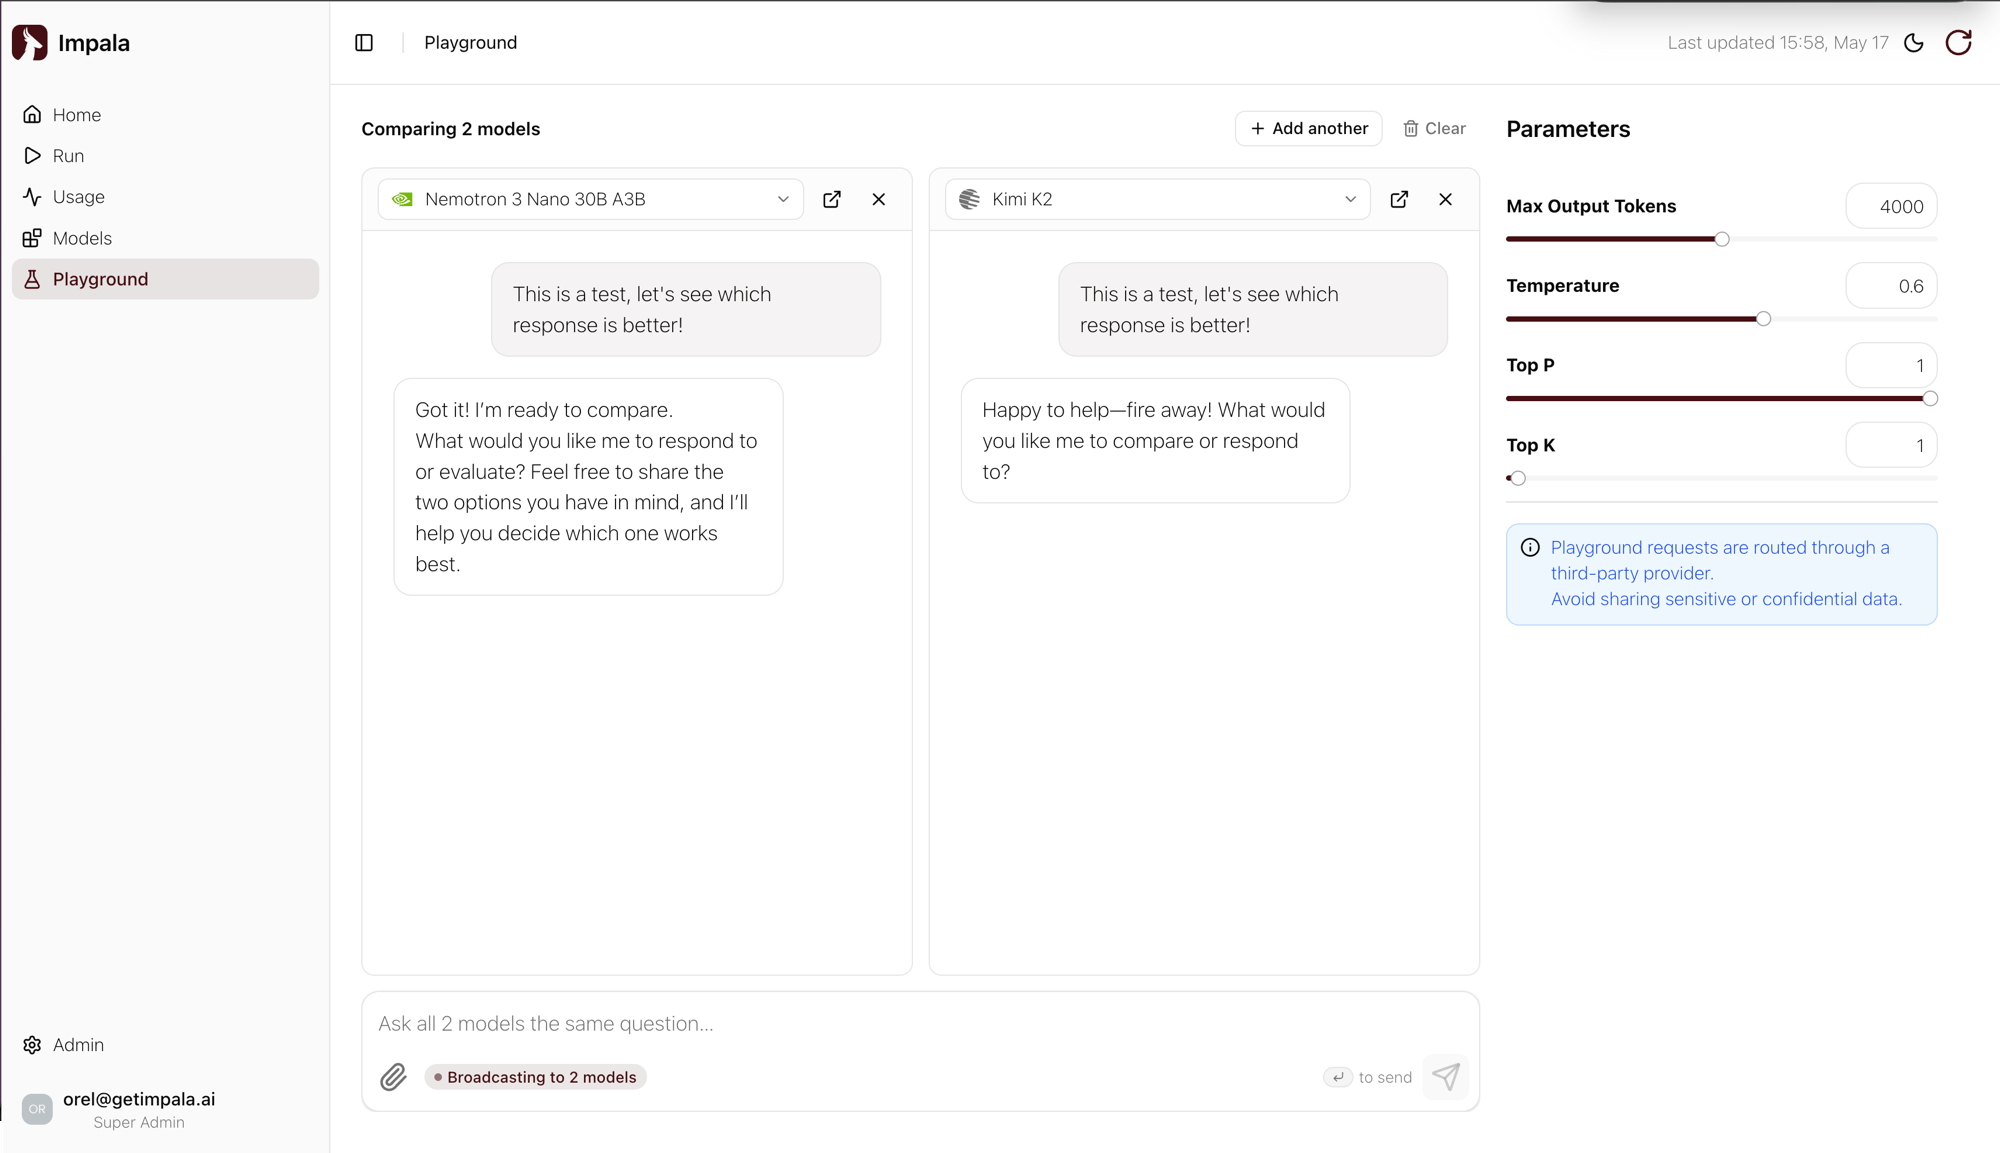
Batch Error Review
When a batch fails, the run details view surfaces the runtime error inline along with a ready-to-copy snippet for pulling the full error file via the API. A faster path from a failed run to a fix.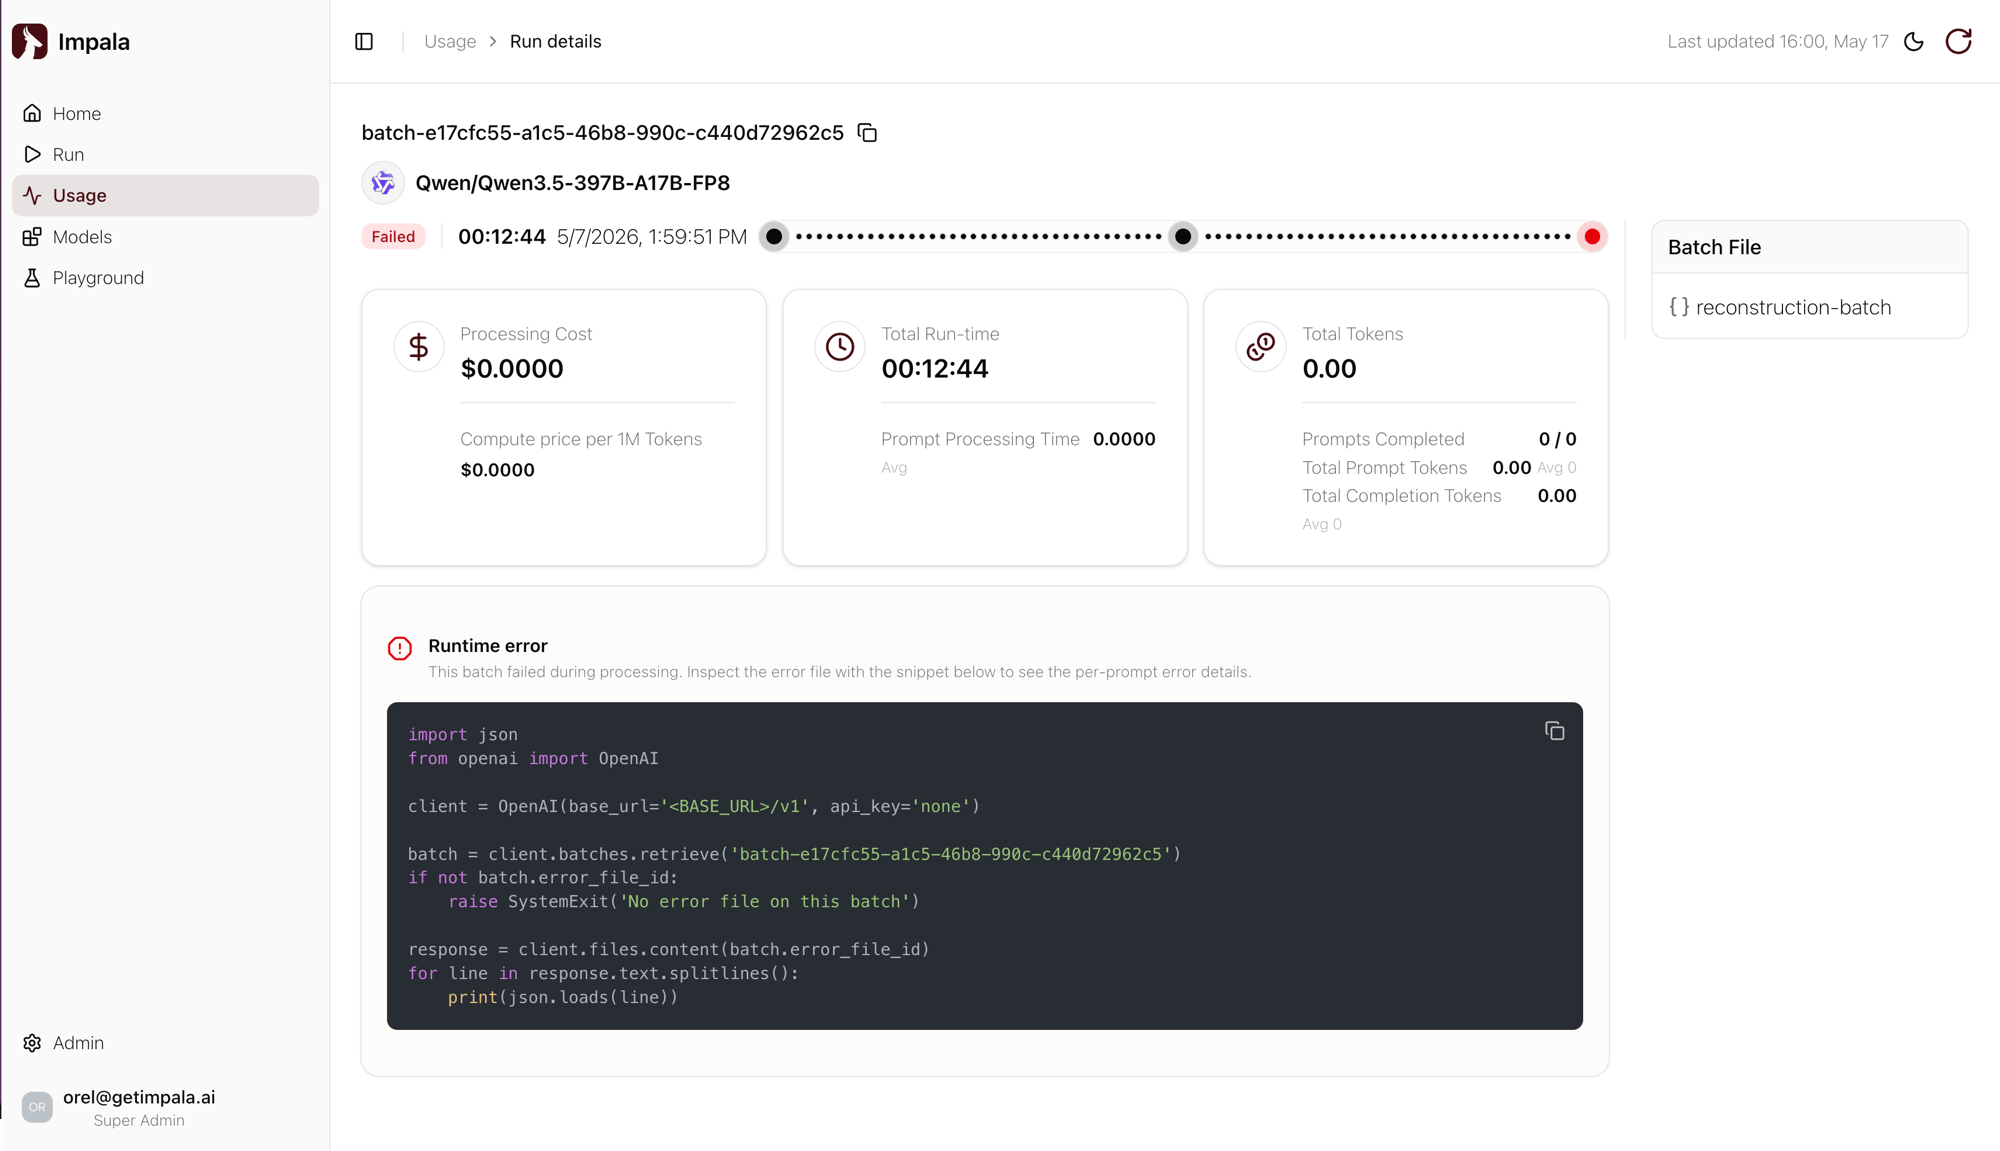
Cross-Region Image URI
Run a batch in region X with the source file uploaded to S3 in region Y — your JSONL and the data plane no longer need to be in the same region. Fewer prerequisites to run batches on Impala.Explore Models
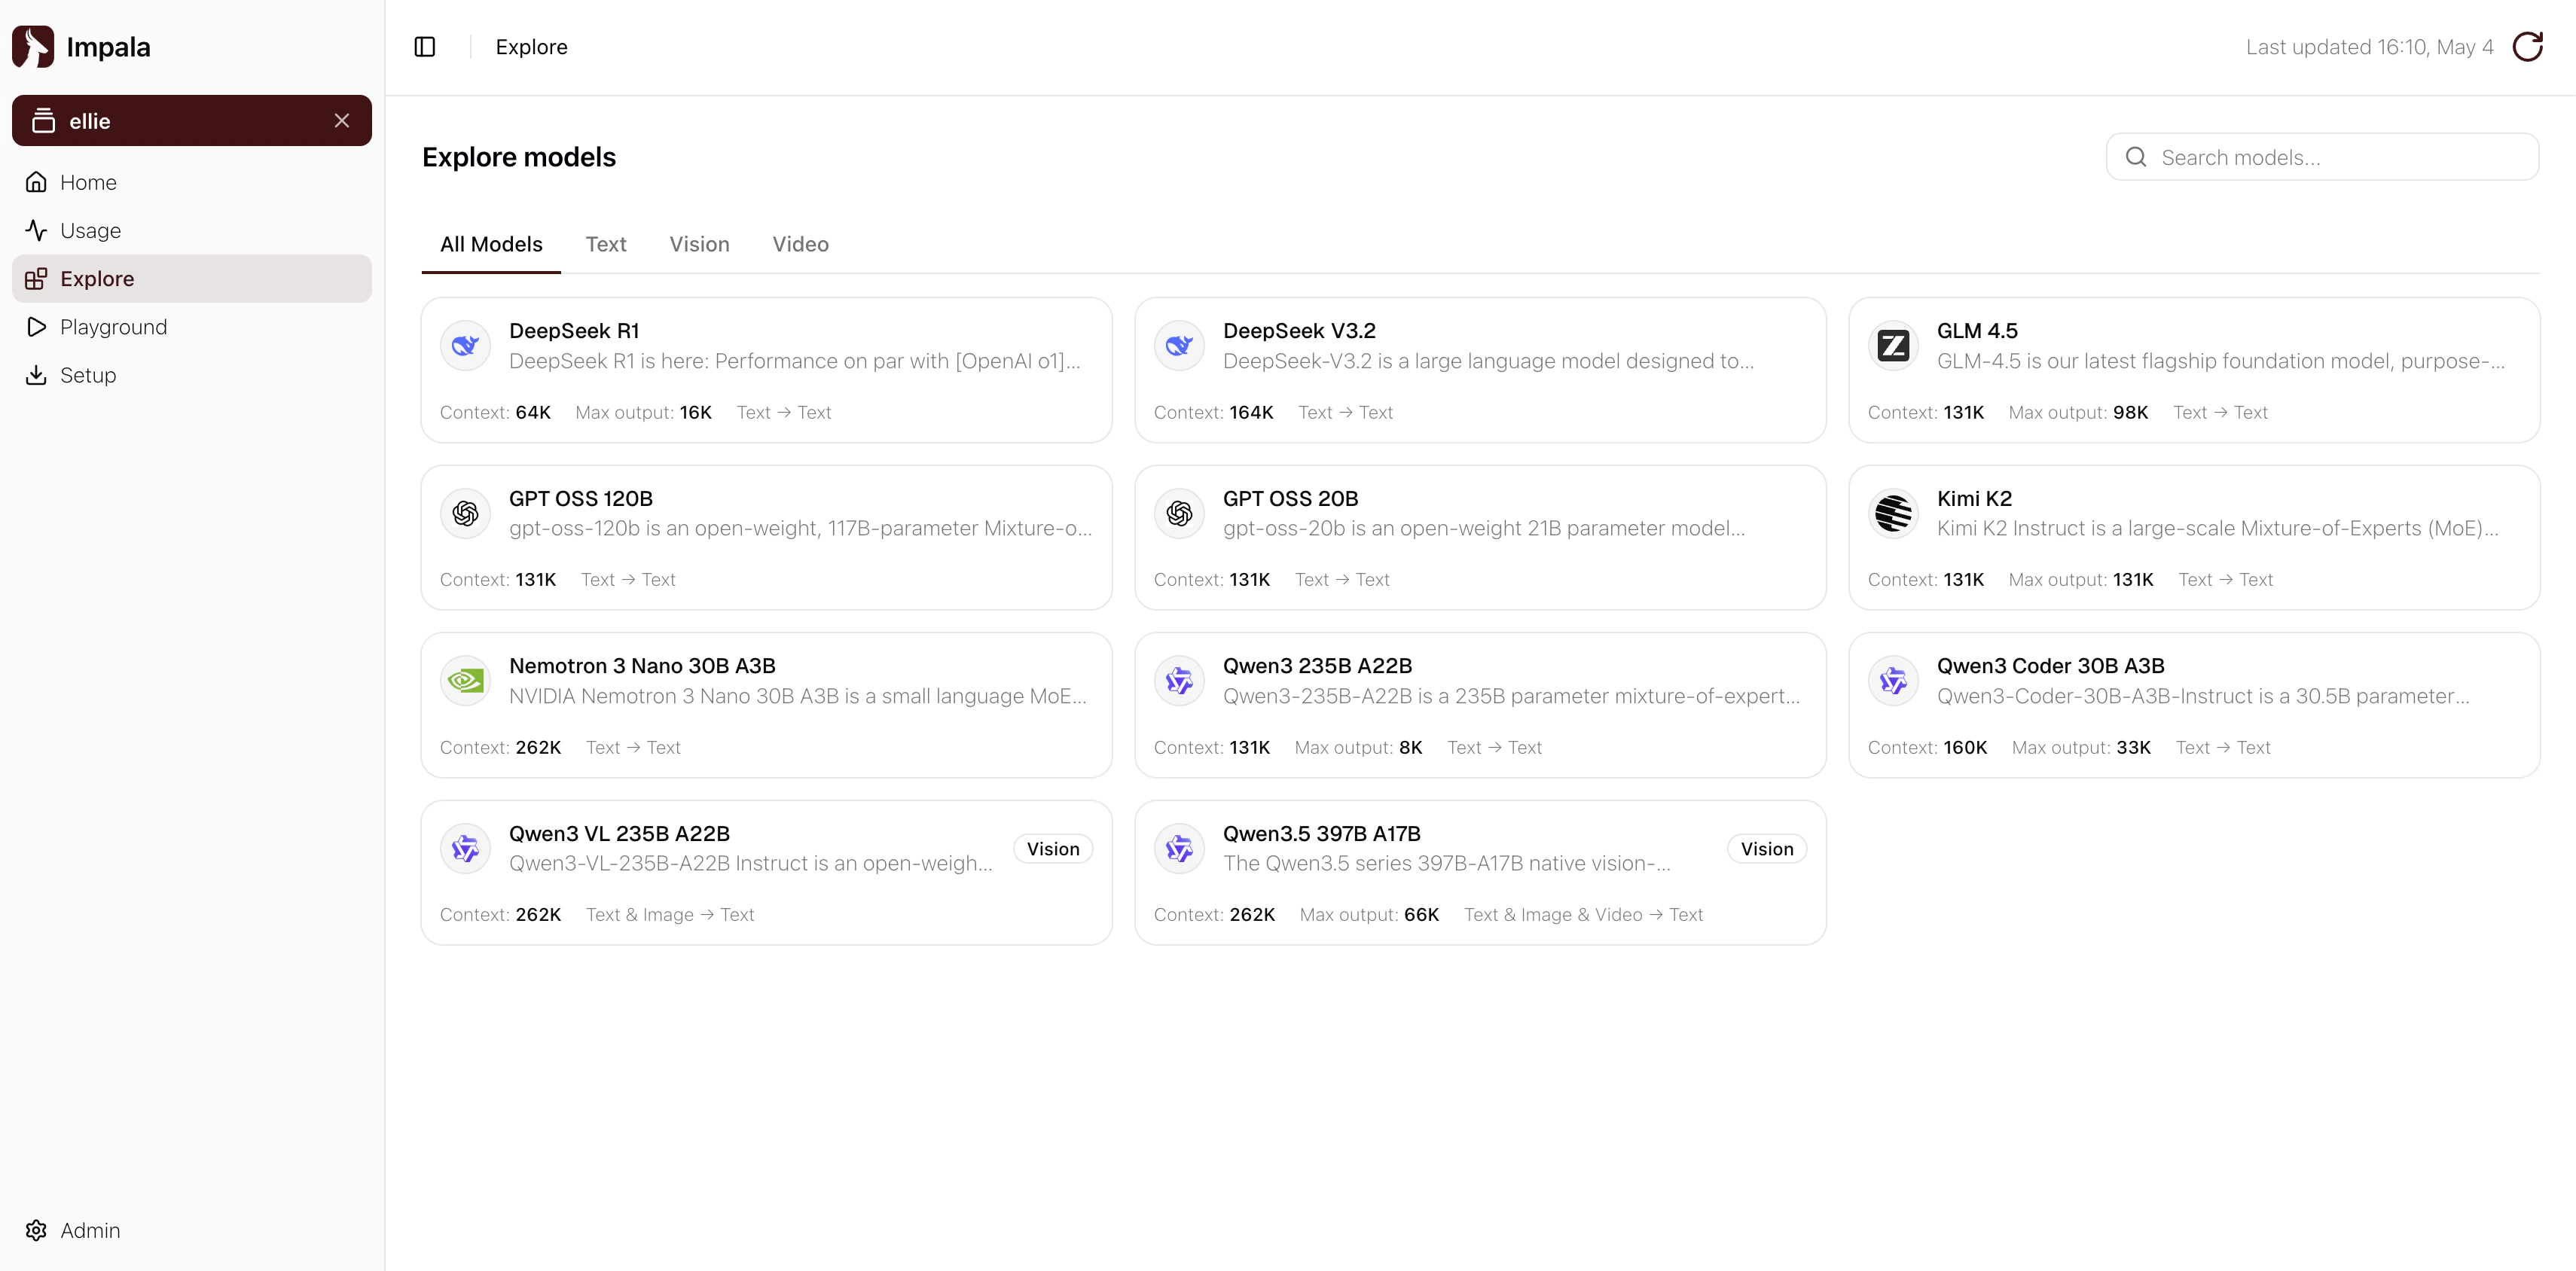
Browse a catalog of models in-app and view the details of each one. Includes quick links to Playground for easy model testing.